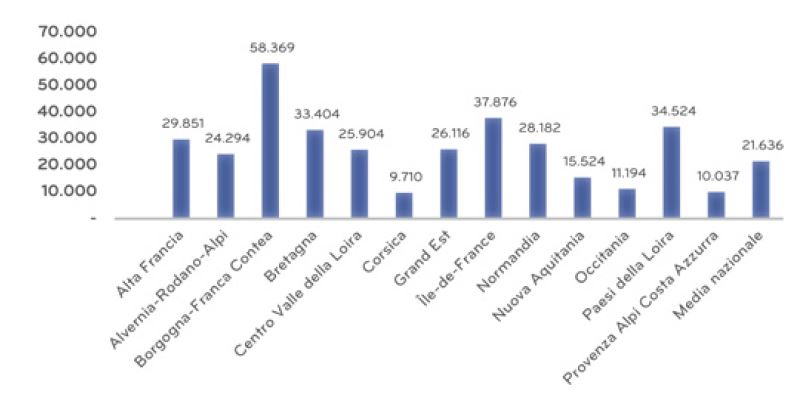

Graph 1 – Number of Inhabitants per Court in France
But what does the French figure—one court for nearly 21,500 inhabitants—really represent? Chart 2, which compares France with several other countries, confirms what we stated at the outset. There is a significant gap, especially when compared to Italy, which has a court-to-population ratio three times higher; in Sweden, it’s nine times higher, and in Spain, it’s as much as twelve times higher.

Number of Inhabitants per Court – Comparative Index (Chart 2)
Size of Facilities
The size of padel centers confirms just how cautious investors still are, both in their approach and in the scale of their ventures. No region has an average of at least four courts, and only three regions have an average above three.
Court Manufacturing Industry
France certainly doesn’t lack know-how. The industry has rapidly mobilized, sensing an emerging business opportunity. Among the companies positioning themselves to capture a significant share of the market, seven stand out: NXP, TecnoPadel, WSport, EPS Concept, Padel Court, Padel International, and Universo Turf. Also present are the Spanish industry leader Padel Galis, and even a Chinese company, Sanjng. Leading Italian manufacturers such as Ecover, Italgreen, and Italian Padel are also trying to export their expertise into this increasingly crowded market.
Conclusions
We can conclude that France has everything it needs—yet the data and empirical studies suggest there are underlying causes behind the sport’s underdevelopment that are not easily identifiable. Still, we can attempt to revisit some of the most likely ones:
Population density
It’s easy to see why population density is a key precondition, not just for padel but for any market. In our research on Sweden, we showed how extremely low density (23 people/km²) can be a major limiting factor. France’s population density is just over half that of Italy (120 vs. 196 people/km²), which still doesn’t fully explain why France has 14 times fewer courts than Italy. The same holds true for urban areas with higher density.
Other sports
Could the popularity of other sports be limiting padel’s growth? We investigated the percentage of participants in football, cycling, and basketball. The only significant difference was found in rugby, where France has 300,000 registered players compared to Italy’s 71,000. Even though this is more than four times greater, it still doesn’t account for the shortfall in padel’s development in France.
Regulations
While EU countries share a common legal framework, differences in how strictly regulations are applied may exist. In particular, the approval time for new padel projects in France appears to be considerably longer—around two years, according to Leonardo Ravizzini, commercial director at Ecover.
Promotional efforts
There’s no clear evidence that the FFT (Fédération Française de Tennis) has invested in promoting padel to the same extent as Italy’s FIT, which even rebranded as FITP in part to reflect this new focus. That said, FFT is at least helping raise the sport’s visibility by hosting a Premier Padel Major at the prestigious Roland Garros complex. Additionally, a padel court was installed under the Eiffel Tower by Padel Galis during last year’s Olympics. This initiative will be repeated from May 20 to July 9, 2025, offering broad exposure to anyone wanting to try the sport. The only catch? A fee of 30 euros per person for 90 minutes.
Unit investment costs nearly tripled
In the past five years, the cost of steel and glass has significantly increased due to various factors. This means that investments now exceed double what they were previously. The situation is further complicated in Northern European countries, where two-thirds of courts are covered, adding more cost. The price of covering a court is roughly equivalent to the court itself and requires additional permits and approvals.
There are two main indicators to evaluate the investment potential of a region or area:
-
A/C1 Index: the ratio of inhabitants per existing court. The higher the index, the more room there is for potential new courts.
-
Population Density: this objectively reflects the number of potential players within a reasonable travel distance (typically 20–30 minutes on average).

Chart 3 – Investment Opportunities in Regions with the Highest Inhabitants-to-Court Ratio Île-de-France stands out as the most promising due to its high population density
We cross-referenced these two variables in Chart 3, and the results show that the Île-de-France region (home to Paris) appears to be the most attractive, with the highest population density and an A/C1 index of over 40,000 inhabitants per court. It is followed by Hauts-de-France. Three other regions, with fewer than 200 inhabitants per km², also present opportunities—not due to population density, but due to their high user-per-court ratios.


